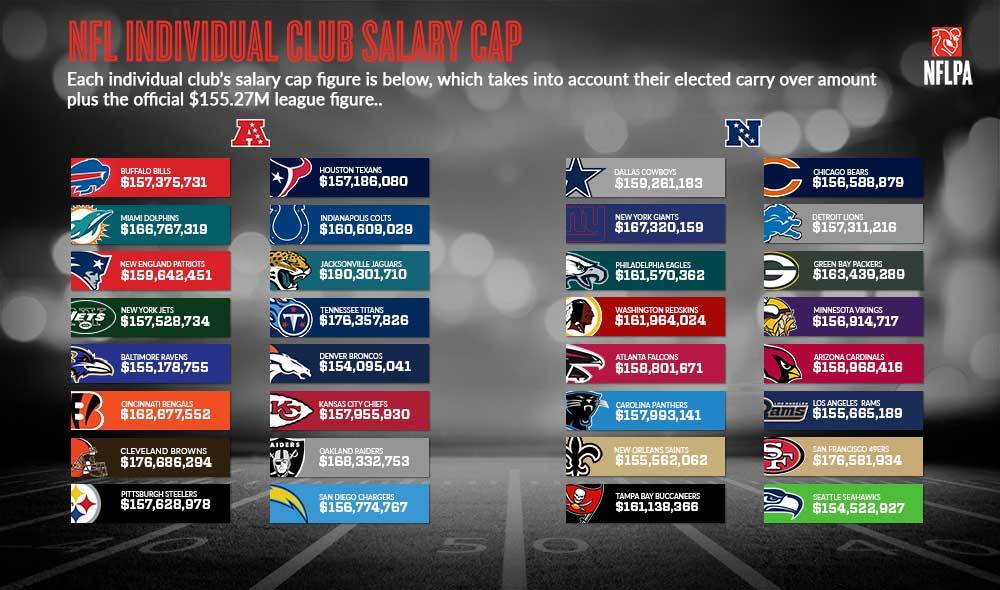
2016 Adjusted Team Salary Caps
2016 ADJUSTED TEAM SALARY CAPS
Adjusted Team Salary Caps combine the league-wide Salary Cap with each team’s carryover and other adjustments from the previous League Year.
With the league-wide cap number in place at a record $155.27 million and final carryover and adjustment amounts reported from individual clubs, adjusted Team Salary Caps can be found below.

Cap Room per Club will be available after the start of the 2016 League Year at 4 p.m. EST on Wednesday, March 9.
UPDATED TABLE (3/9/2016 4:58 p.m. EST) - Changes to 2015 Adjustments (and therefore 2016 Adjusted Team Cap) for Buffalo, Detroit and San Francisco:
Team | League-Wide Salary Cap | Carryover from 2015 | Adjustments from 2015 | 2016 Adjusted Team Cap |
Arizona Cardinals | $155,270,000 | $3,031,663 | $666,753 | $158,968,416 |
Atlanta Falcons | $155,270,000 | $3,905,771 | ($374,100) | $158,801,671 |
Baltimore Ravens | $155,270,000 | $1,633,944 | ($1,725,189) | $155,178,755 |
Buffalo Bills | $155,270,000 | $4,467,331 | ($2,241,900) | $157,495,431 |
Carolina Panthers | $155,270,000 | $3,731,200 | ($1,008,059) | $157,993,141 |
Chicago Bears | $155,270,000 | $867,589 | $451,290 | $156,588,879 |
Cincinnati Bengals | $155,270,000 | $7,587,902 | ($180,350) | $162,677,552 |
Cleveland Browns | $155,270,000 | $20,734,144 | $682,150 | $176,686,294 |
Dallas Cowboys | $155,270,000 | $3,571,239 | $419,944 | $159,261,183 |
Denver Broncos | $155,270,000 | $3,300,000 | ($4,474,959) | $154,095,041 |
Detroit Lions | $155,270,000 | $862,191 | $2,459,025 | $158,591,216 |
Green Bay Packers | $155,270,000 | $6,953,847 | $1,215,442 | $163,439,289 |
Houston Texans | $155,270,000 | $1,637,055 | $279,025 | $157,186,080 |
Indianapolis Colts | $155,270,000 | $4,950,629 | $388,400 | $160,609,029 |
Jacksonville Jaguars | $155,270,000 | $32,774,928 | $2,256,782 | $190,301,710 |
Kansas City Chiefs | $155,270,000 | $2,622,838 | $63,092 | $157,955,930 |
Los Angeles Rams | $155,270,000 | $933,521 | ($538,332) | $155,665,189 |
Miami Dolphins | $155,270,000 | $9,137,544 | $2,359,775 | $166,767,319 |
Minnesota Vikings | $155,270,000 | $2,090,409 | ($445,692) | $156,914,717 |
New England Patriots | $155,270,000 | $1,347,882 | $3,024,569 | $159,642,451 |
New Orleans Saints | $155,270,000 | $1,400,000 | ($1,107,938) | $155,562,062 |
New York Giants | $155,270,000 | $11,193,231 | $856,928 | $167,320,159 |
New York Jets | $155,270,000 | $2,484,216 | ($225,482) | $157,528,734 |
Oakland Raiders | $155,270,000 | $13,373,617 | ($310,864) | $168,332,753 |
Philadelphia Eagles | $155,270,000 | $7,255,362 | ($955,000) | $161,570,362 |
Pittsburgh Steelers | $155,270,000 | $3,000,327 | ($641,349) | $157,628,978 |
San Diego Chargers | $155,270,000 | $2,287,176 | ($782,409) | $156,774,767 |
San Francisco 49ers | $155,270,000 | $12,206,686 | $9,115,248 | $176,591,934 |
Seattle Seahawks | $155,270,000 | $11,587 | ($758,660) | $154,522,927 |
Tampa Bay Buccaneers | $155,270,000 | $7,987,748 | ($2,119,382) | $161,138,366 |
Tennessee Titans | $155,270,000 | $20,783,801 | $304,025 | $176,357,826 |
Washington Redskins | $155,270,000 | $5,837,734 | $856,290 | $161,964,024 |
*There may be slight changes in some final numbers before the start of the 2016 League Year. Any changes are expected to be negligible.
###